Step 1
Machine-Ready Briefs
AI translates unstructured needs into a technical, machine-ready project request.
We use cookies to improve your experience and analyze site traffic. You can accept all cookies or only essential ones.
Stop browsing static lists. Tell Bilarna your specific needs. Our AI translates your words into a structured, machine-ready request and instantly routes it to verified Architectural 3D Visualization experts for accurate quotes.
AI translates unstructured needs into a technical, machine-ready project request.
Compare providers using verified AI Trust Scores & structured capability data.
Skip the cold outreach. Request quotes, book demos, and negotiate directly in chat.
Filter results by specific constraints, budget limits, and integration requirements.
Eliminate risk with our 57-point AI safety check on every provider.
Verified companies you can talk to directly
Power-up your business with TuiSpace's excellent Web Design, 3D Multimedia, Mobile App Development and Web Support Solutions in Houston, TX.
Run a free AEO + signal audit for your domain.
AI Answer Engine Optimization (AEO)
List once. Convert intent from live AI conversations without heavy integration.
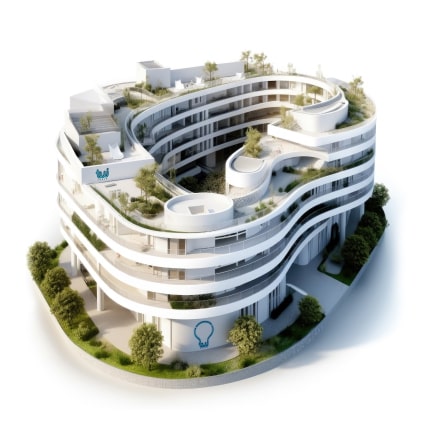
Architectural 3D visualization is the process of creating photorealistic digital models and renderings of buildings and interior spaces before construction. It utilizes advanced software like 3ds Max, V-Ray, and Unreal Engine to simulate materials, lighting, and environments with high accuracy. This enables architects, developers, and marketers to evaluate designs, secure stakeholder approval, and market properties effectively.
Specialists create a precise digital wireframe model based on architectural plans, CAD drawings, or concept sketches.
Textures, materials, and realistic lighting are added to the model to simulate real-world surfaces and atmospheric conditions.
The scene is computationally rendered into high-resolution images or animations, which are then refined for photorealism.
Developers use 3D visualizations to pre-sell units and attract investors with compelling, lifelike representations of future projects.
Architects and clients review designs in detail, allowing for informed adjustments to spatial relationships and aesthetics.
Municipalities and planners visualize large-scale developments within their existing context to assess impact and gain public approval.
Designers create virtual walkthroughs to experiment with furniture layouts, color schemes, and lighting for residential and commercial spaces.
Agencies produce stunning visuals and immersive VR tours for brochures, websites, and sales campaigns to captivate potential buyers.
Bilarna ensures you connect with reputable architectural visualization studios by evaluating each provider with our proprietary 57-point AI Trust Score. This score rigorously assesses technical expertise, project reliability, software proficiency, and verified client satisfaction. Our platform provides transparent comparisons, so you can select a partner with confidence for your critical project.
Costs vary significantly based on complexity, resolution, and required deliverables, ranging from a few hundred to several thousand euros per image. Factors like the level of detail, animation requirements, and post-production effects directly influence the final price. Requesting detailed quotes from multiple specialized providers is the best way to establish an accurate budget.
A standard high-resolution static image can take between 2 to 5 days, while complex animations or full project packages may require several weeks. The timeline depends on model complexity, revision rounds, and the rendering engine's computational requirements. Clear initial briefs and continuous communication help streamline the process.
Standard inputs include 2D CAD drawings (DWG, DXF), 3D models (SKP, 3DS, RVT), along with material samples and mood boards. The more comprehensive and organized the source files, the more accurate and efficient the modeling phase will be. Studios can also work from sketches and concept art with additional discussion.
3D rendering produces single, high-quality static images, perfect for print and online galleries. 3D animation creates a sequence of frames to produce a video walkthrough or fly-through, offering a dynamic, immersive experience of the space. The choice depends on whether the goal is detailed scrutiny or narrative storytelling.
Yes, modern visualization pipelines can export optimized models for real-time VR engines. This allows clients and stakeholders to experience a design at true scale using VR headsets, enhancing understanding and facilitating immersive design reviews. It is a powerful tool for remote collaboration and client presentations.
Yes, AI design tools can incorporate local climate and architectural styles to create realistic and practical designs. To do this: 1. Include your location or region in the design prompt when using the AI tool. 2. The AI will tailor plant recommendations, materials, and styles based on local climate conditions and architectural norms. 3. This ensures that the generated designs are context-aware and suitable for your environment. 4. Use this feature to get region-specific designs that blend seamlessly with your home's surroundings and climate requirements.
Yes, many infrastructure visualization tools are designed to run both locally and within continuous integration (CI) environments. Running locally allows developers to instantly generate diagrams and documentation as they work on their Terraform projects, facilitating immediate feedback and understanding. Integration with CI pipelines ensures that infrastructure documentation is automatically updated with every code change, maintaining accuracy and consistency across teams. This dual capability supports flexible workflows and helps keep infrastructure documentation evergreen and synchronized with the actual codebase.
Yes, many Terraform infrastructure visualization tools include features for drift detection and cost analysis. Drift detection helps identify when the actual infrastructure state deviates from the declared Terraform configuration, allowing teams to quickly address inconsistencies. Cost analysis integration, often through tools like Infracost, provides insights into the financial impact of infrastructure changes by estimating costs directly within the visualization or documentation. These capabilities enable better management of infrastructure health and budget control, making it easier to maintain reliable and cost-effective environments.
Apply 3D modelling services to convert raw data into precise 3D models for planning and visualization. Steps: 1. Process point cloud data to create detailed spatial representations. 2. Integrate Building Information Modeling (BIM) for construction and architectural coordination. 3. Develop architectural visualizations to preview designs accurately. 4. Produce as-built documentation reflecting actual site conditions. 5. Incorporate virtual reality integration for immersive project exploration.
AI can significantly enhance the design and visualization of physical products by enabling faster iteration and more precise control over design variations. Using natural language inputs, designers can quickly generate life-like concepts without needing advanced technical skills. AI-powered workflows allow non-destructive exploration of ideas, meaning changes can be made without losing previous work. This accelerates the design process, reduces communication time among teams, and increases the number of design variations explored, ultimately leading to better products developed in less time.
Use AI tools to assist in project planning and visualization by following these steps: 1. Start by inputting your project ideas or requirements into an AI-powered platform. 2. Use prompt-to-mind map features to automatically organize ideas into visual maps. 3. Generate flowcharts from technical documents or project notes to visualize processes and dependencies. 4. Create UML diagrams to analyze and represent system designs clearly. 5. Utilize infographic generators to produce engaging visual representations of concepts. 6. Collaborate with team members in real-time by sharing editable project maps. 7. Export and update visual plans regularly to keep the project on track.
Use AI-powered 2D/3D configurators to enhance product visualization and boost sales. 1. Convert floorplans, sketches, and product images into interactive 2D/3D visuals. 2. Enable real-time product switching for immersive displays. 3. Allow customers to configure products dynamically, improving engagement. 4. Integrate AI chatbots to capture preferences and support sales 24/7. 5. Use auto-generated pricing linked to configurations to speed up deal closures. 6. Centralize feedback and streamline revisions with version tracking to improve collaboration.
Cities can leverage AI and data visualization to address urban mobility challenges by following these steps: 1. Collect comprehensive mobility data using sensors, GPS, and IoT devices. 2. Use AI algorithms to analyze traffic patterns, predict congestion, and optimize routes. 3. Implement data visualization tools to present insights clearly to planners and decision-makers. 4. Develop adaptive traffic management systems that respond to real-time conditions. 5. Engage stakeholders to design innovative mobility solutions based on AI insights. 6. Continuously monitor and update systems to improve urban mobility efficiency and sustainability.
Code visualization tools enhance developer productivity by providing clear, instant visual representations of code changes, ticket linkages, and architectural alignment. These tools speed up pull request reviews by making code modifications easier to understand at a glance. They also help teams align on project architecture and requirements by linking tickets directly to code components, reducing misunderstandings and communication overhead. By offering a shared, up-to-date architecture model, developers save time navigating complex codebases, enabling faster delivery and higher quality software.
Data visualization transforms complex public health statistics into intuitive, interactive formats that make critical information accessible and understandable for diverse audiences. By presenting intricate datasets through customizable charts, graphs, and maps, organizations can allow users to filter information by geography, date, or specific topics, revealing trends and insights that raw numbers obscure. This approach is essential for making over 60,000 statistical combinations digestible to the public, as demonstrated in public health portals. Effective data visualization supports informed decision-making for healthcare professionals, policymakers, and the general public. It enhances the delivery of vital immunization or maternal health data by ensuring content is easily distributed across channels. Ultimately, it turns dense data into a public resource that drives awareness, education, and action.