Step 1
Machine-Ready Briefs
AI translates unstructured needs into a technical, machine-ready project request.
We use cookies to improve your experience and analyze site traffic. You can accept all cookies or only essential ones.
Stop browsing static lists. Tell Bilarna your specific needs. Our AI translates your words into a structured, machine-ready request and instantly routes it to verified Data Analysis & Insights experts for accurate quotes.
AI translates unstructured needs into a technical, machine-ready project request.
Compare providers using verified AI Trust Scores & structured capability data.
Skip the cold outreach. Request quotes, book demos, and negotiate directly in chat.
Filter results by specific constraints, budget limits, and integration requirements.
Eliminate risk with our 57-point AI safety check on every provider.
Verified companies you can talk to directly
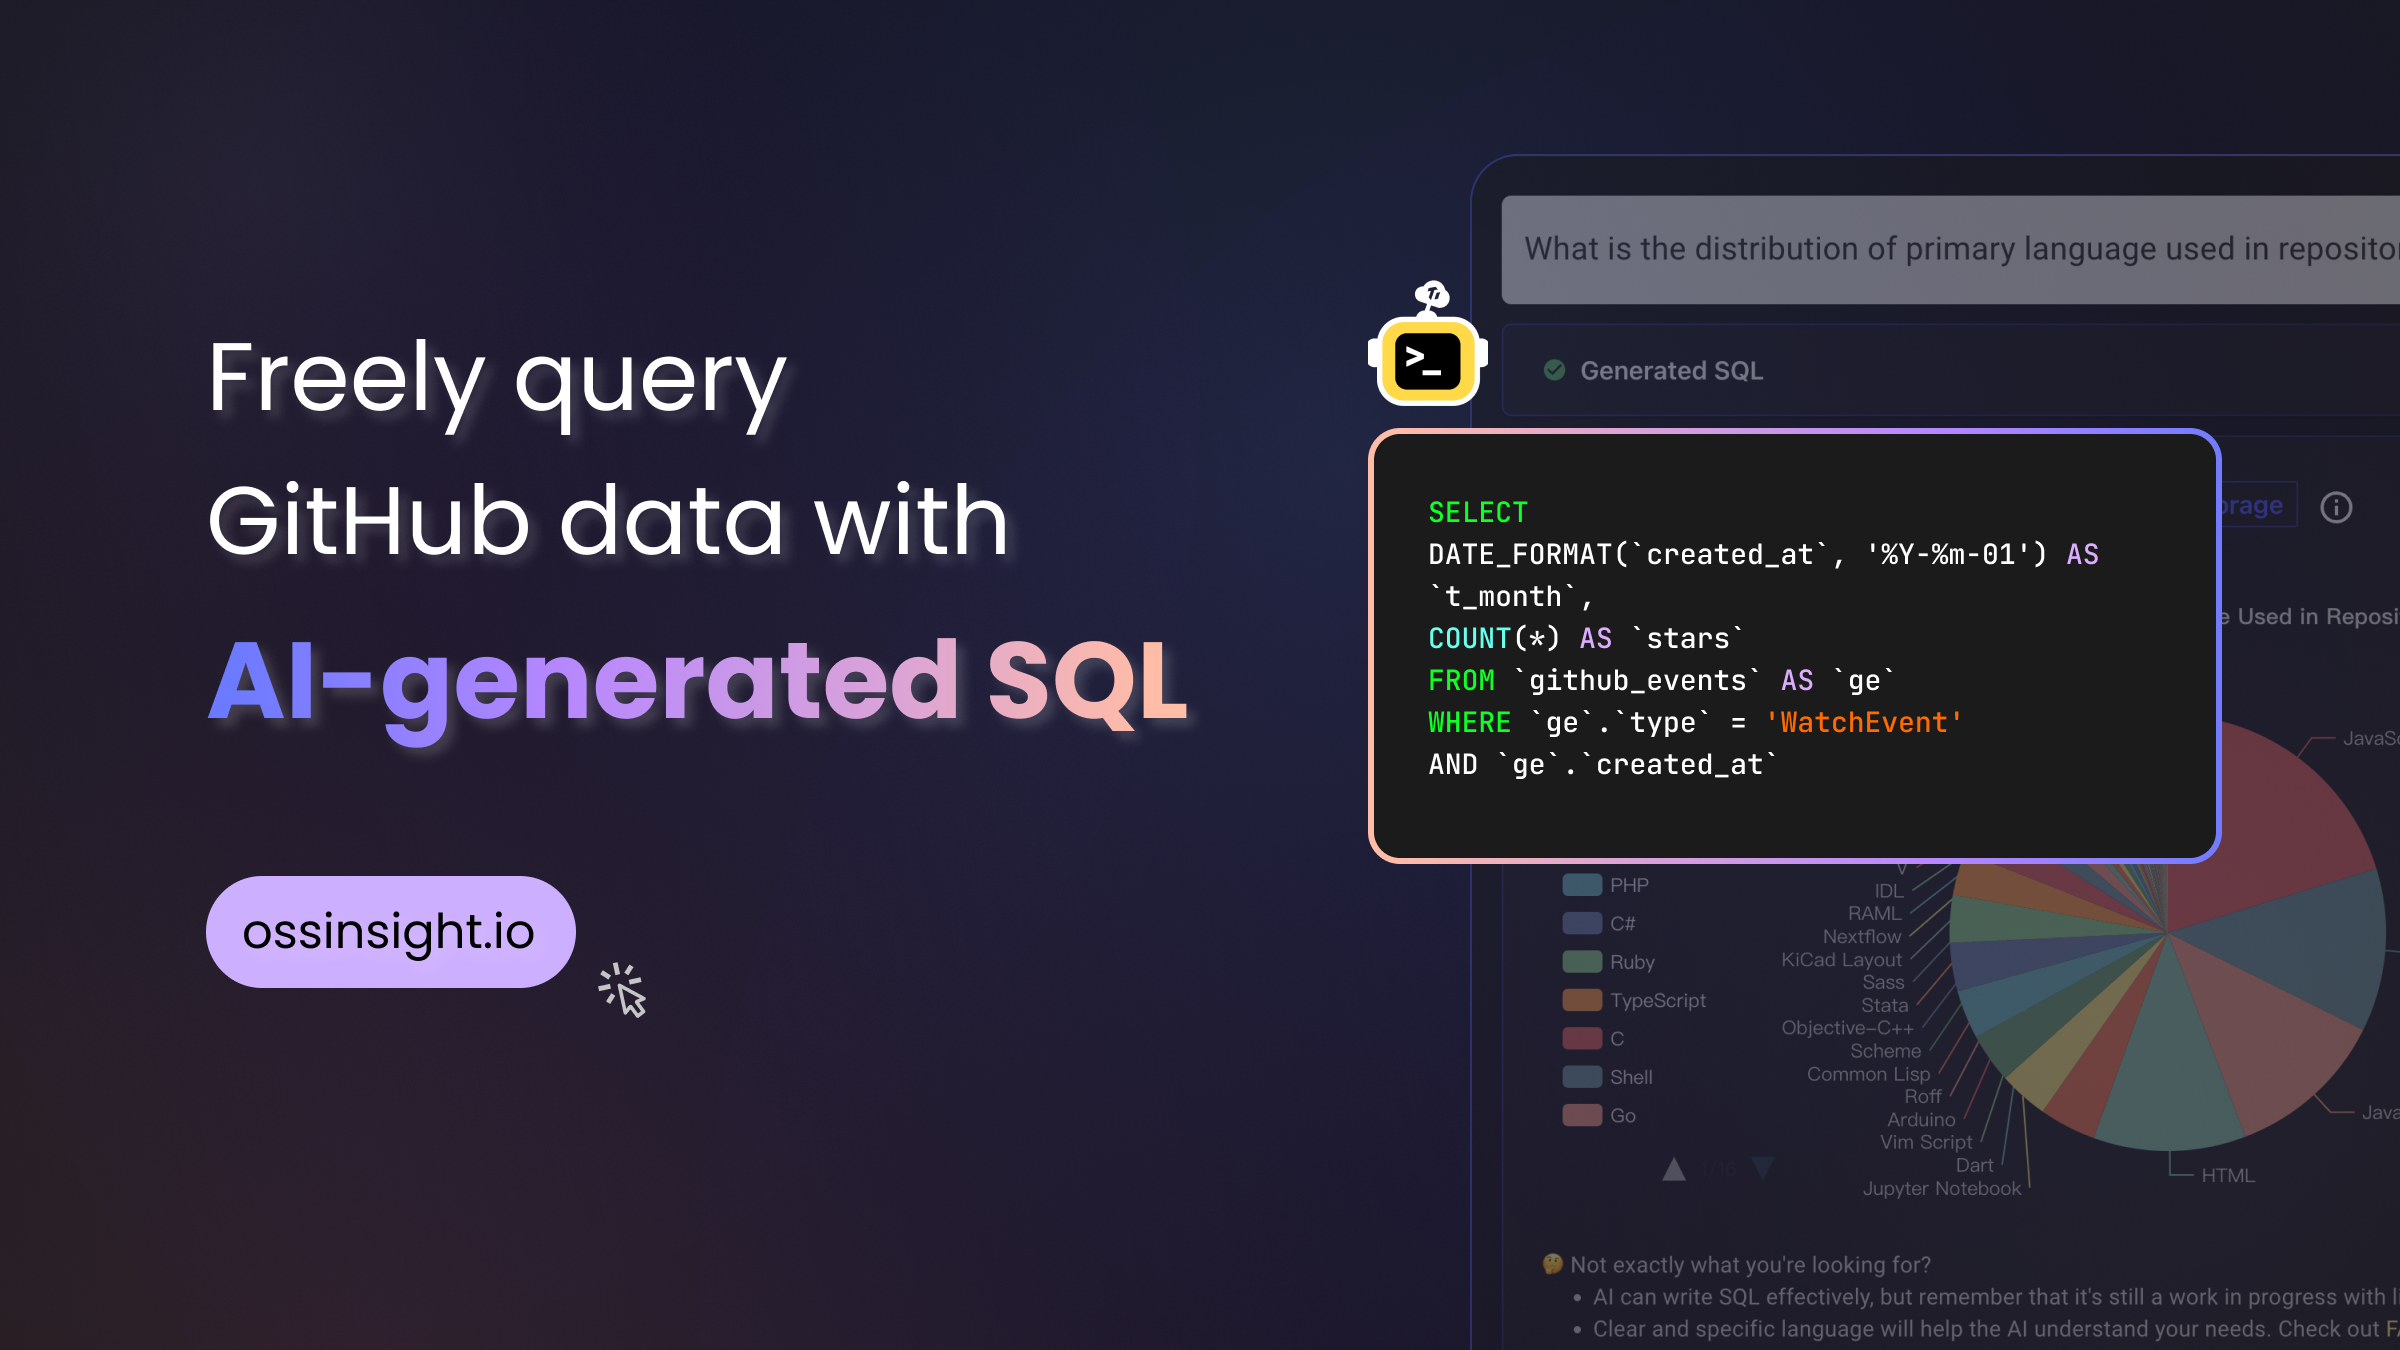
Simply ask your question in natural language and Data Explore will generate SQL, query the data, and present the results visually.

Formula Bot is your AI-powered data analyst. Generate formulas, analyze spreadsheets, create charts, and get instant insights. Trusted by 1M+ users worldwide.
Formula Bot is your AI-powered data analyst. Generate formulas, analyze spreadsheets, create charts, and get instant insights. Trusted by 1M+ users worldwide.
Agentic AI platform designed by investment professionals and bankers to power sourcing, diligence, and strategy. Custom AI agents trained on proven methodologies with access to 20M+ companies and 30+ premium data subscriptions.
Super Amplify is an AI platform that enables businesses to leverage AI to automate their processes and make data-driven decisions.
Qluent is an AI-powered business analytics assistant that enables non-technical users to access and explore their data through natural language queries.

Meet Viq, your AI co-pilot in the first-ever Agentic OS for Commerce. Unify your tools, automate complex workflows, and command your business growth from one central AI Command Centre.

Capture, organise, and analyse data effortlessly with SmartSaaS. Our AI-powered platform automates business tasks and delivers actionable insights.
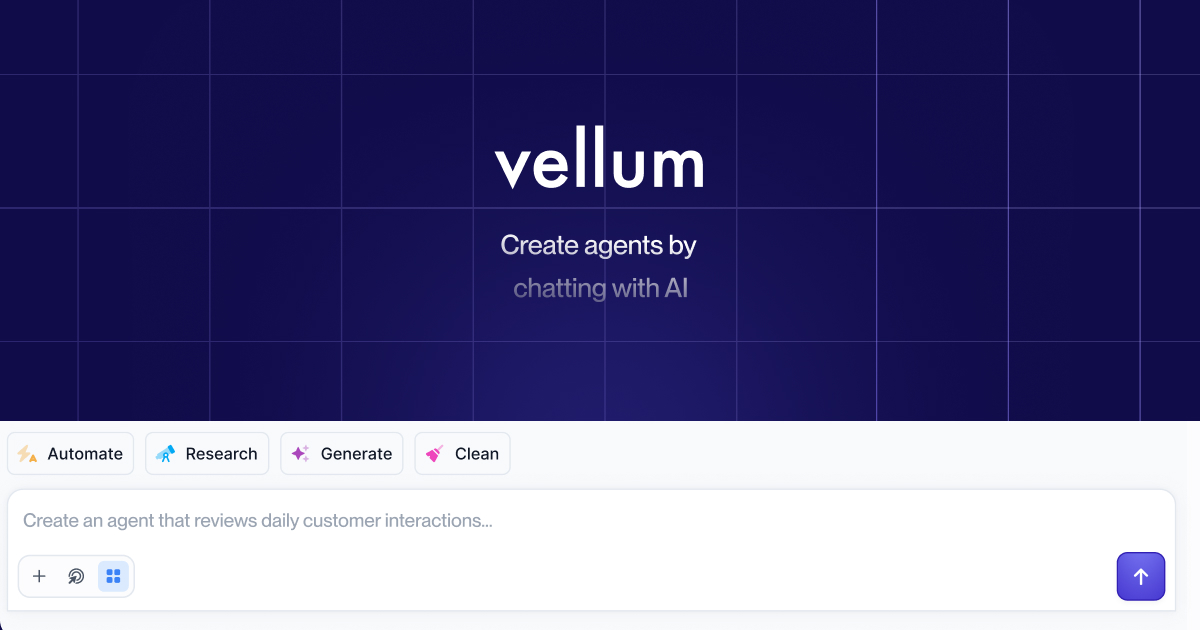
Create powerful AI agents by chatting with AI. With Vellum, just describe what you want and your agent starts working. What once took a team of engineers now takes a single conversation.
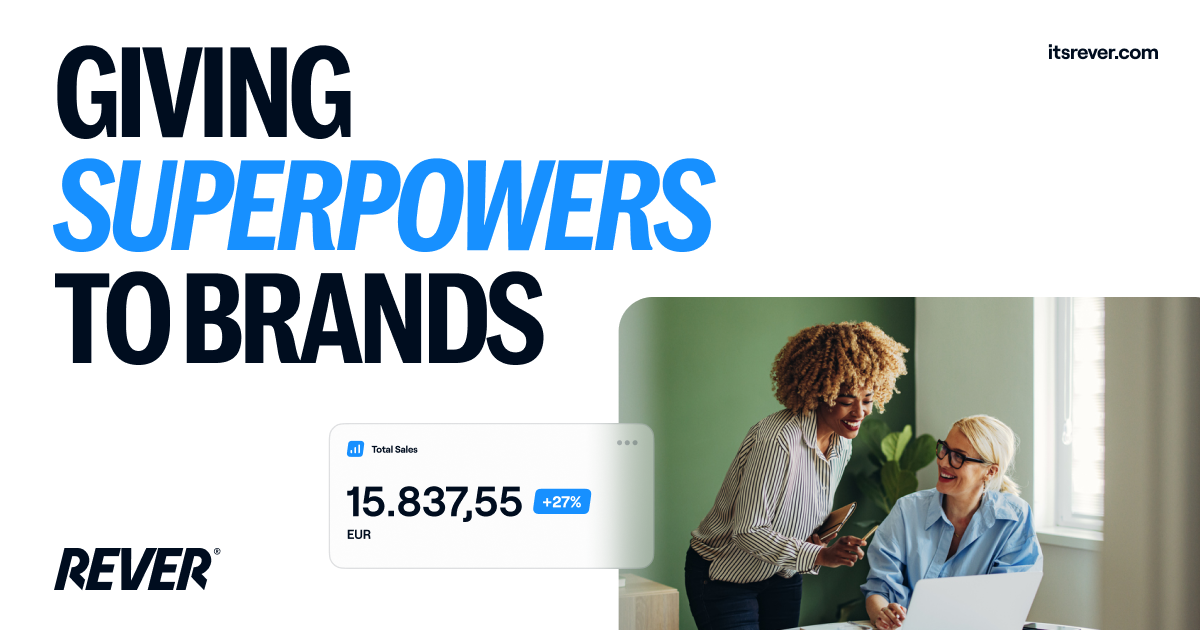
REVER is born to disrupt how eCommerce returns work by making them easier and faster for everyone.
Tergle builds AI agents for auditors. Book a demo today!

Building BOND, your AI Chief of Staff

Your home for data science and AI. The world’s leading publication for data science, data analytics, data engineering, machine learning, and artificial intelligence professionals.
Run a free AEO + signal audit for your domain.
AI Answer Engine Optimization (AEO)
List once. Convert intent from live AI conversations without heavy integration.
Data analysis and insights is the systematic process of examining datasets to draw conclusions and support data-driven decision-making. It leverages statistical methods, machine learning algorithms, and visualization tools to identify patterns, trends, and anomalies. This practice empowers organizations to optimize operations, predict market shifts, and enhance customer experiences.
Organizations first establish clear business questions and the key metrics required to answer them, setting the scope for the analysis.
Specialists then clean, transform, and apply analytical models to the prepared data to uncover meaningful patterns and relationships.
The final step involves translating complex results into clear, actionable insights and strategic recommendations for stakeholders.
Banks use predictive analytics to assess credit risk, detect fraudulent transactions in real-time, and ensure regulatory compliance.
Hospitals analyze patient data to predict readmission risks, personalize treatment plans, and improve operational efficiency.
Retailers leverage customer behavior data to power recommendation engines, optimize pricing, and forecast inventory demand.
Factories utilize sensor data analysis to predict equipment failures, schedule proactive maintenance, and minimize downtime.
Software companies analyze user interaction data to identify feature adoption bottlenecks and guide product development roadmaps.
Bilarna evaluates every provider through a proprietary 57-point AI Trust Score, assessing technical expertise, project delivery history, and client satisfaction metrics. This continuous monitoring includes verification of relevant certifications, portfolio depth, and compliance with data security standards. We ensure you only compare thoroughly vetted data analysis partners.
Costs vary significantly based on project scope, data complexity, and required expertise, typically ranging from retained consulting agreements to per-project fees. Defining clear objectives and data readiness is crucial for an accurate quote. Most providers offer tailored pricing models.
A standard project timeline spans from several weeks for a focused analysis to multiple months for building comprehensive data pipelines and predictive models. Duration depends on data volume, quality, and the complexity of the desired business insights. Phased approaches are common for large initiatives.
Business Intelligence (BI) focuses on descriptive analytics, reporting past performance via dashboards. Data Science employs advanced statistical and machine learning techniques for predictive and prescriptive analytics, forecasting future outcomes. Both are complementary components of a modern data strategy.
Prioritize proven expertise in your industry, a robust methodology for data governance, and strong communication skills for translating technical findings. Evaluate their tool stack, case studies, and ability to deliver actionable, not just descriptive, insights. Technical certifications are a strong trust signal.
Common pitfalls include unclear business objectives, poor data quality at the source, and a failure to align technical outputs with strategic decision-making processes. Successful projects require cross-functional collaboration and a clear plan for operationalizing the insights generated.
Yes, AI masks are legally safe and users retain ownership by following these steps: 1. Verify your real identity as required by the platform to comply with legal regulations. 2. Use AI masks ethically and avoid violating terms of service. 3. Understand that AI masks are generated and do not steal anyone's identity. 4. Create and publish content with AI masks knowing you have full commercial license and ownership over your masked videos and photos. 5. Avoid using AI masks for unethical purposes to maintain compliance and safety.
AI photo filters require credits to use. New users receive 10 free credits upon registration to try the filters. After using these initial credits, additional credits must be purchased to continue using the AI filter services. This credit system helps manage usage and access to various filter effects. Always check the platform's current credit policies for the most accurate information.
Yes, AI voice and SMS agents designed for healthcare are built with security and compliance in mind. They adhere to industry standards and regulations such as HIPAA (Health Insurance Portability and Accountability Act) to protect patient data privacy and security. Business Associate Agreements (BAAs) are available to formalize compliance commitments. Additionally, these agents comply with regulations like TCPA (Telephone Consumer Protection Act) and PCI (Payment Card Industry) standards where applicable. Ensuring security and regulatory compliance is critical to maintaining trust and safeguarding sensitive healthcare information while leveraging AI technologies.
Confirm that AI-generated poems are free from copyright and plagiarism by following these steps: 1. Understand that poems are created by an AI language model trained on a custom dataset. 2. Recognize that each poem is unique and not copied from existing works. 3. Use the poems freely for commercial or noncommercial purposes without needing permission or attribution. 4. Trust that the AI ensures originality and copyright-free content.
Yes, ongoing changes and updates to a website are typically included in a standard monthly subscription fee. This service model ensures your site remains functional, modern, and up-to-date without incurring additional one-off costs for modifications. The included updates cover content changes, minor design tweaks, and general maintenance to keep the site running smoothly. This approach provides predictable budgeting and continuous support, allowing you to adapt your site as your business evolves. It is distinct from one-time development projects and focuses on long-term site management.
Yes, cheap Windows product keys from reputable online retailers can be legitimate and safe, provided they are sourced from verified channels. These sellers typically obtain surplus or volume license keys from legitimate distributors, making them genuine Microsoft licenses at a lower cost. The key safety indicators include the seller providing a money-back guarantee, offering instant email delivery of the key, and having clear customer support for activation issues. It is crucial to avoid keys sold at prices that seem too good to be true, as these may be unauthorized or volume license violations. A legitimate key will activate your Windows or Office software permanently and grant access to all official updates and features from Microsoft without legal risk.
Yes, when properly manufactured and maintained, copper water bottles and cookware are considered safe and healthy. Copper is a natural mineral that the human body requires in trace amounts. Water stored in a copper bottle for several hours undergoes a natural purification process through the release of copper ions, which is traditionally believed to support digestion and immunity. For cookware, a key safety feature is the interior tinning, which creates a protective barrier that prevents food from directly contacting the copper, ensuring safe cooking and preserving flavor. It is important to avoid storing highly acidic foods in copper for prolonged periods and to maintain the tin lining when it wears down from regular use. These traditional practices ensure the health benefits and safety of using quality copper products.
Extended warranties on appliances and electronics are often not worth the cost for most consumers due to their low statistical likelihood of paying out relative to their price. Retailers aggressively sell these warranties because they are highly profitable, with a significant portion of the fee being pure margin. The manufacturer's original warranty already covers the initial period when defects are most likely to appear. For products with a high reliability rate, you are essentially betting against the odds, and the cost of the warranty may approach or even exceed the probable repair cost. A more financially prudent approach is to self-insure by setting aside the money you would have spent on warranties into a savings fund dedicated for potential repairs or future replacement, which gives you flexibility and control over the funds.
Local bank transfers are often offered without any fees, allowing you to send money to any local bank account without incurring charges. Many services provide unlimited free transfers to local banks, ensuring that you can move funds easily and cost-effectively. Additionally, there are usually no account maintenance fees or hidden charges associated with these transfers. It's important to verify with your service provider to confirm that no fees apply, but generally, local transfers are designed to be free and transparent.
Yes, conversations with AI companions are private and secure. To ensure confidentiality, platforms use advanced encryption and data protection measures. Steps to maintain privacy include: 1. Encrypting chat data during transmission and storage. 2. Implementing strict access controls to prevent unauthorized access. 3. Regularly updating security protocols to address vulnerabilities. 4. Providing users with privacy policies detailing data handling. Always verify the platform's security features before use.