Step 1
Comparison Shortlist
Machine-Ready Briefs: AI turns undefined needs into a technical project request.
We use cookies to improve your experience and analyze site traffic. You can accept all cookies or only essential ones.
Stop browsing static lists. Tell Bilarna your specific needs. Our AI translates your words into a structured, machine-ready request and instantly routes it to verified Data Visualization & Dashboard Tools experts for accurate quotes.
Machine-Ready Briefs: AI turns undefined needs into a technical project request.
Verified Trust Scores: Compare providers using our 57-point AI safety check.
Direct Access: Skip cold outreach. Request quotes and book demos directly in chat.
Precision Matching: Filter matches by specific constraints, budget, and integrations.
Risk Elimination: Validated capacity signals reduce evaluation drag & risk.
Ranked by AI Trust Score & Capability
Run a free AEO + signal audit for your domain.
AI Answer Engine Optimization (AEO)
List once. Convert intent from live AI conversations without heavy integration.
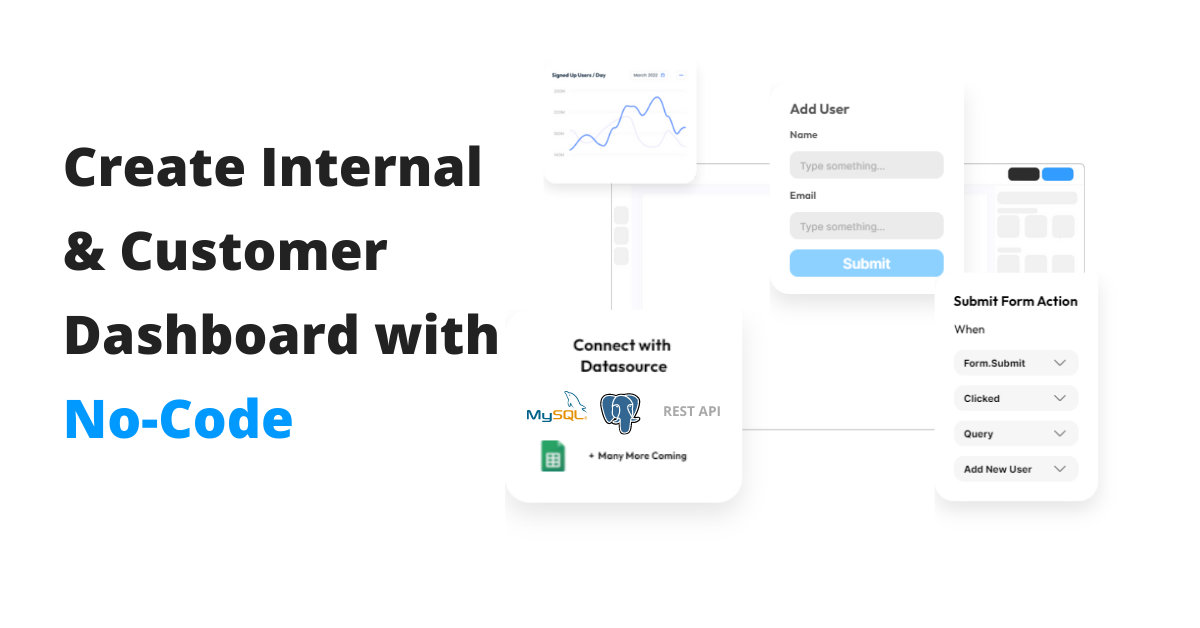
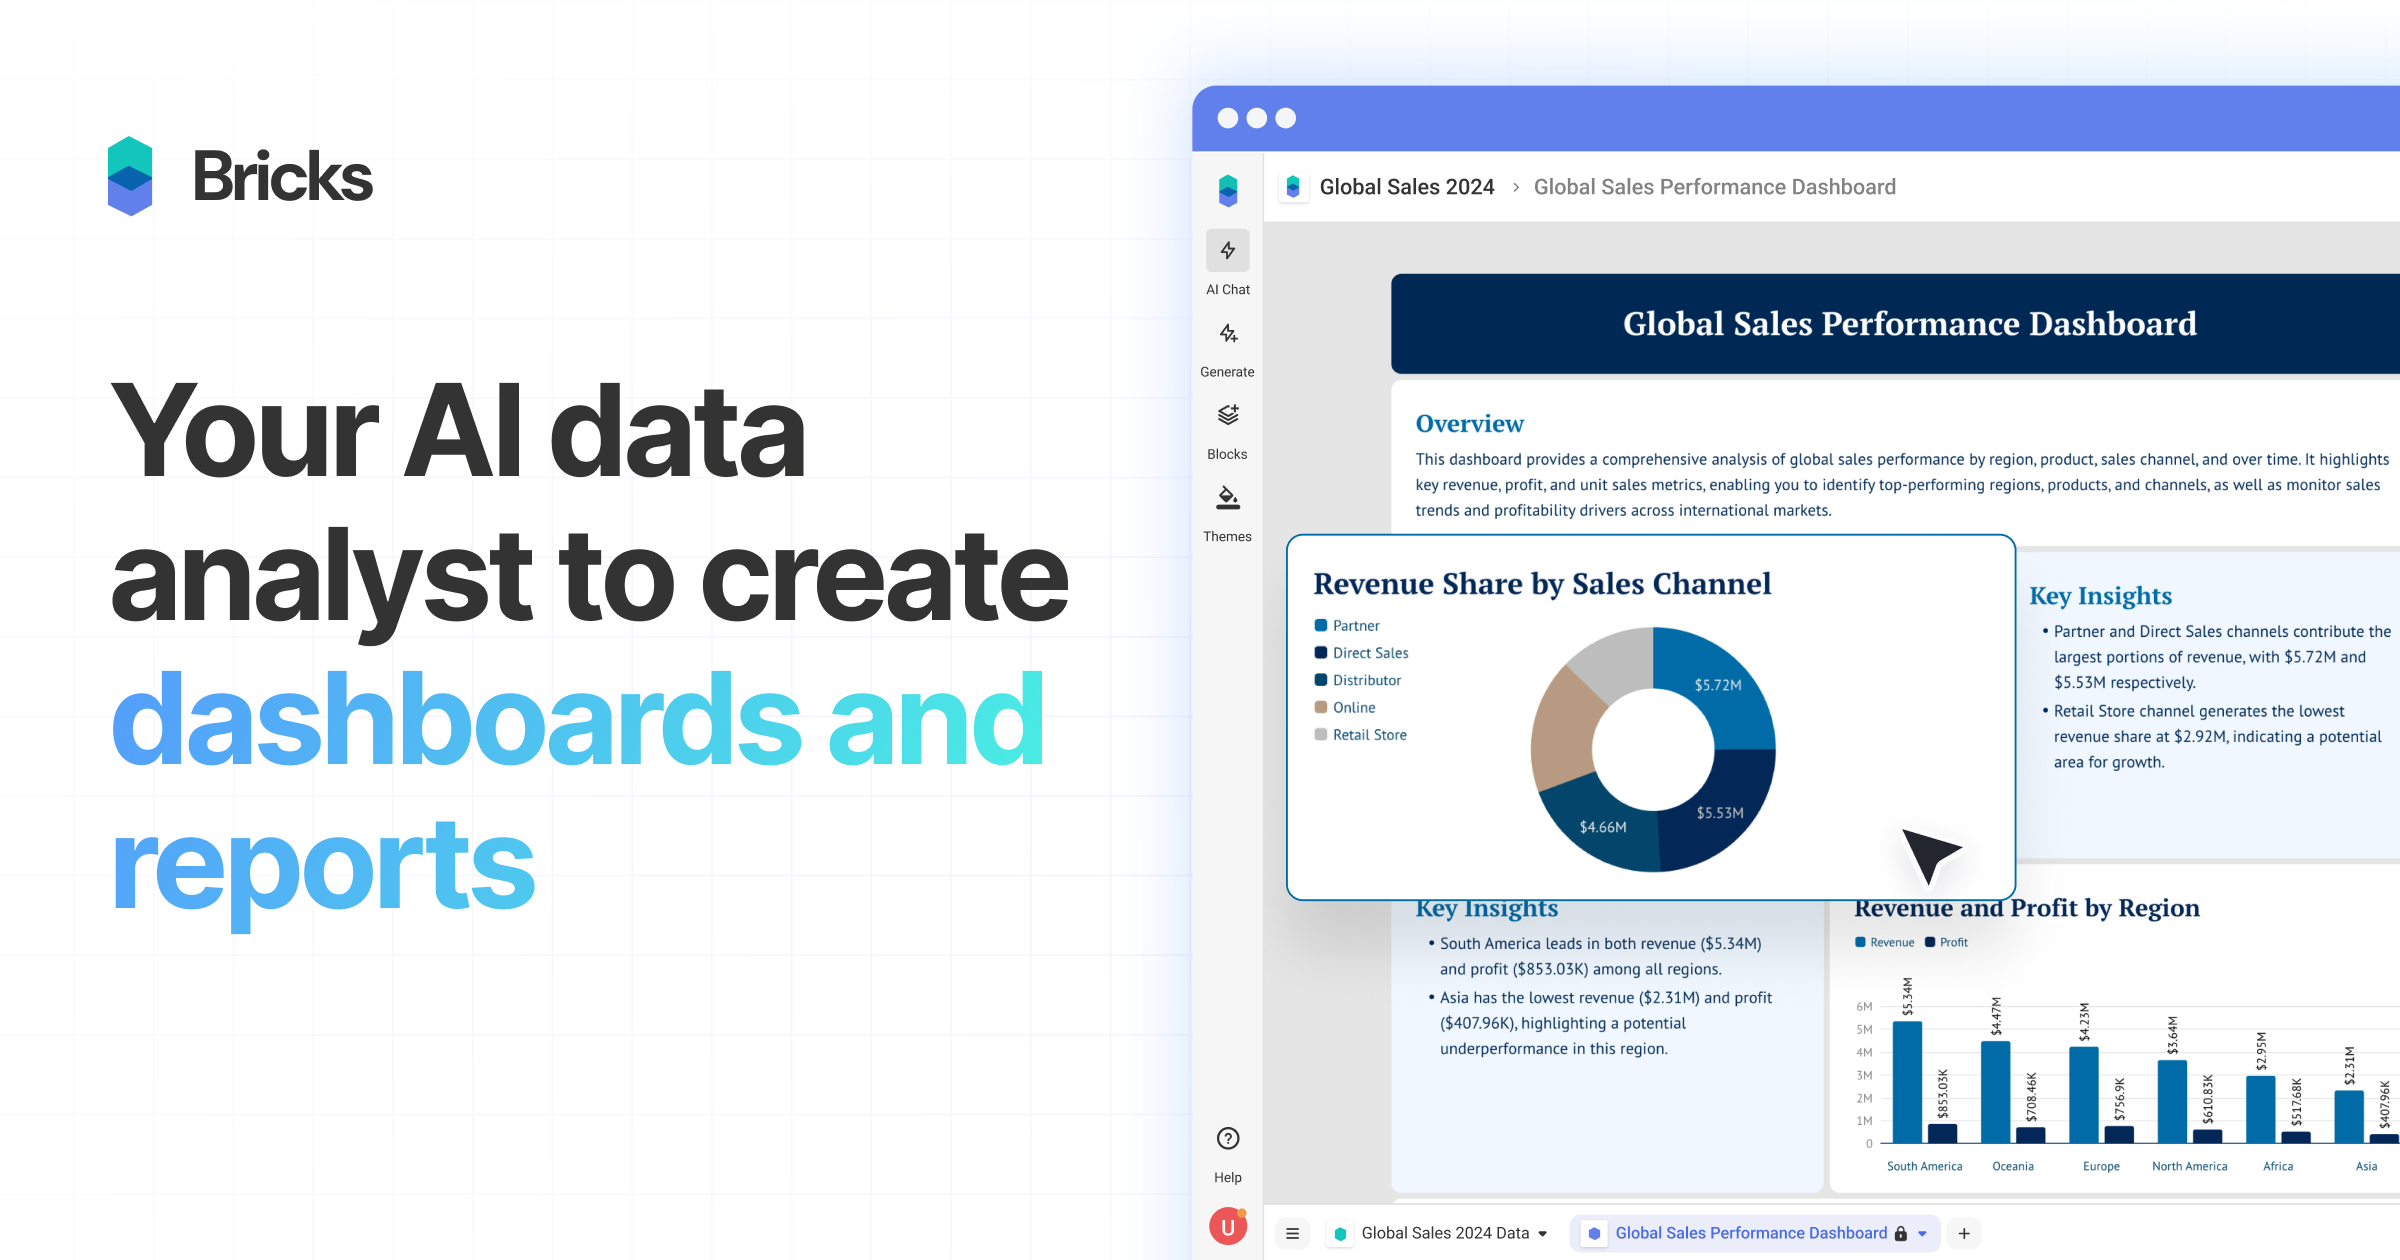
This category encompasses tools designed to help users create interactive dashboards and visualize data effectively. These solutions enable businesses and individuals to convert raw data from spreadsheets, databases, or other sources into engaging visual formats. They support features like drag-and-drop interfaces, customizable themes, real-time data updates, and interactive filters, making data analysis accessible and insightful. Such tools are essential for data-driven decision-making, reporting, and storytelling, allowing users to uncover patterns, trends, and insights with ease. They cater to a wide range of users, from small organizations to large enterprises, seeking to simplify complex data and communicate findings visually.
Providers of these tools include software companies specializing in data visualization, business intelligence, and dashboard solutions. Many are cloud-based platforms offering subscription models, allowing users to access powerful features without extensive setup. These companies often focus on user-friendly interfaces, customization options, and integrations with popular data sources like Google Sheets, Excel, and databases. They serve a diverse clientele, from small startups to large enterprises, across various industries such as finance, marketing, healthcare, and education. The providers typically offer training, support, and updates to ensure users maximize the value of their tools and stay current with evolving data visualization trends.
Delivery and setup typically involve cloud-based deployment with user-friendly interfaces requiring minimal technical knowledge. Pricing models are often subscription-based, offering tiered plans to suit different organizational sizes and needs. Implementation is straightforward, with many providers offering onboarding tutorials, support, and training sessions. Updates and new features are usually rolled out automatically, ensuring users always have access to the latest tools. Customization options allow users to tailor dashboards to their branding and data requirements. Overall, these tools emphasize ease of use, affordability, and quick deployment, making them accessible to a broad audience without extensive technical setup.
Reputable AI girlfriend apps prioritize user safety and privacy through encryption, data anonymization, and strict no-tracking policies. Conversations are typically end-to-end encrypted, meaning neither the company nor third parties can read them. Many platforms do not store personal information or share data with advertisers. They allow users to interact anonymously without linking to real-world identities. Additionally, these apps often include features like auto-deletion of chat logs, biometric authentication, and the option to use pseudonyms. However, safety also depends on the user's own practices, such as avoiding sharing sensitive personal information. It is important to choose apps that have transparent privacy policies, undergo independent security audits, and are developed by teams with expertise in ethical AI. Overall, when used responsibly and on trusted platforms, AI girlfriend apps can provide a secure environment for emotional exploration and companionship.
Yes, AI masks are legally safe and users retain ownership by following these steps: 1. Verify your real identity as required by the platform to comply with legal regulations. 2. Use AI masks ethically and avoid violating terms of service. 3. Understand that AI masks are generated and do not steal anyone's identity. 4. Create and publish content with AI masks knowing you have full commercial license and ownership over your masked videos and photos. 5. Avoid using AI masks for unethical purposes to maintain compliance and safety.
AI photo filters require credits to use. New users receive 10 free credits upon registration to try the filters. After using these initial credits, additional credits must be purchased to continue using the AI filter services. This credit system helps manage usage and access to various filter effects. Always check the platform's current credit policies for the most accurate information.
Yes, AI voice and SMS agents designed for healthcare are built with security and compliance in mind. They adhere to industry standards and regulations such as HIPAA (Health Insurance Portability and Accountability Act) to protect patient data privacy and security. Business Associate Agreements (BAAs) are available to formalize compliance commitments. Additionally, these agents comply with regulations like TCPA (Telephone Consumer Protection Act) and PCI (Payment Card Industry) standards where applicable. Ensuring security and regulatory compliance is critical to maintaining trust and safeguarding sensitive healthcare information while leveraging AI technologies.
Confirm that AI-generated poems are free from copyright and plagiarism by following these steps: 1. Understand that poems are created by an AI language model trained on a custom dataset. 2. Recognize that each poem is unique and not copied from existing works. 3. Use the poems freely for commercial or noncommercial purposes without needing permission or attribution. 4. Trust that the AI ensures originality and copyright-free content.
Yes, ongoing changes and updates to a website are typically included in a standard monthly subscription fee. This service model ensures your site remains functional, modern, and up-to-date without incurring additional one-off costs for modifications. The included updates cover content changes, minor design tweaks, and general maintenance to keep the site running smoothly. This approach provides predictable budgeting and continuous support, allowing you to adapt your site as your business evolves. It is distinct from one-time development projects and focuses on long-term site management.
Yes, cheap Windows product keys from reputable online retailers can be legitimate and safe, provided they are sourced from verified channels. These sellers typically obtain surplus or volume license keys from legitimate distributors, making them genuine Microsoft licenses at a lower cost. The key safety indicators include the seller providing a money-back guarantee, offering instant email delivery of the key, and having clear customer support for activation issues. It is crucial to avoid keys sold at prices that seem too good to be true, as these may be unauthorized or volume license violations. A legitimate key will activate your Windows or Office software permanently and grant access to all official updates and features from Microsoft without legal risk.
Yes, when properly manufactured and maintained, copper water bottles and cookware are considered safe and healthy. Copper is a natural mineral that the human body requires in trace amounts. Water stored in a copper bottle for several hours undergoes a natural purification process through the release of copper ions, which is traditionally believed to support digestion and immunity. For cookware, a key safety feature is the interior tinning, which creates a protective barrier that prevents food from directly contacting the copper, ensuring safe cooking and preserving flavor. It is important to avoid storing highly acidic foods in copper for prolonged periods and to maintain the tin lining when it wears down from regular use. These traditional practices ensure the health benefits and safety of using quality copper products.
Extended warranties on appliances and electronics are often not worth the cost for most consumers due to their low statistical likelihood of paying out relative to their price. Retailers aggressively sell these warranties because they are highly profitable, with a significant portion of the fee being pure margin. The manufacturer's original warranty already covers the initial period when defects are most likely to appear. For products with a high reliability rate, you are essentially betting against the odds, and the cost of the warranty may approach or even exceed the probable repair cost. A more financially prudent approach is to self-insure by setting aside the money you would have spent on warranties into a savings fund dedicated for potential repairs or future replacement, which gives you flexibility and control over the funds.
Yes, this page sells inflatable beds. Two models are listed: a 3-person inflatable bed measuring 203 x 183 x 22 cm, priced at 1,950 TL after discount, and a 2-person inflatable bed measuring 191 x 137 x 22 cm, priced at 1,260 TL after discount. Both come with a manual hand pump included. They are significantly cheaper than the pools, making them accessible for camping, guests, or extra sleeping space. The page offers free shipping on these items as well. The inflatable beds are standalone products for sleeping. No additional features like built-in pillows are mentioned, but the dimensions suggest ample space for one to three people.