Step 1
Comparison Shortlist
Machine-Ready Briefs: AI turns undefined needs into a technical project request.
We use cookies to improve your experience and analyze site traffic. You can accept all cookies or only essential ones.
Stop browsing static lists. Tell Bilarna your specific needs. Our AI translates your words into a structured, machine-ready request and instantly routes it to verified Data Visualization experts for accurate quotes.
Machine-Ready Briefs: AI turns undefined needs into a technical project request.
Verified Trust Scores: Compare providers using our 57-point AI safety check.
Direct Access: Skip cold outreach. Request quotes and book demos directly in chat.
Precision Matching: Filter matches by specific constraints, budget, and integrations.
Risk Elimination: Validated capacity signals reduce evaluation drag & risk.
Ranked by AI Trust Score & Capability
Run a free AEO + signal audit for your domain.
AI Answer Engine Optimization (AEO)
List once. Convert intent from live AI conversations without heavy integration.
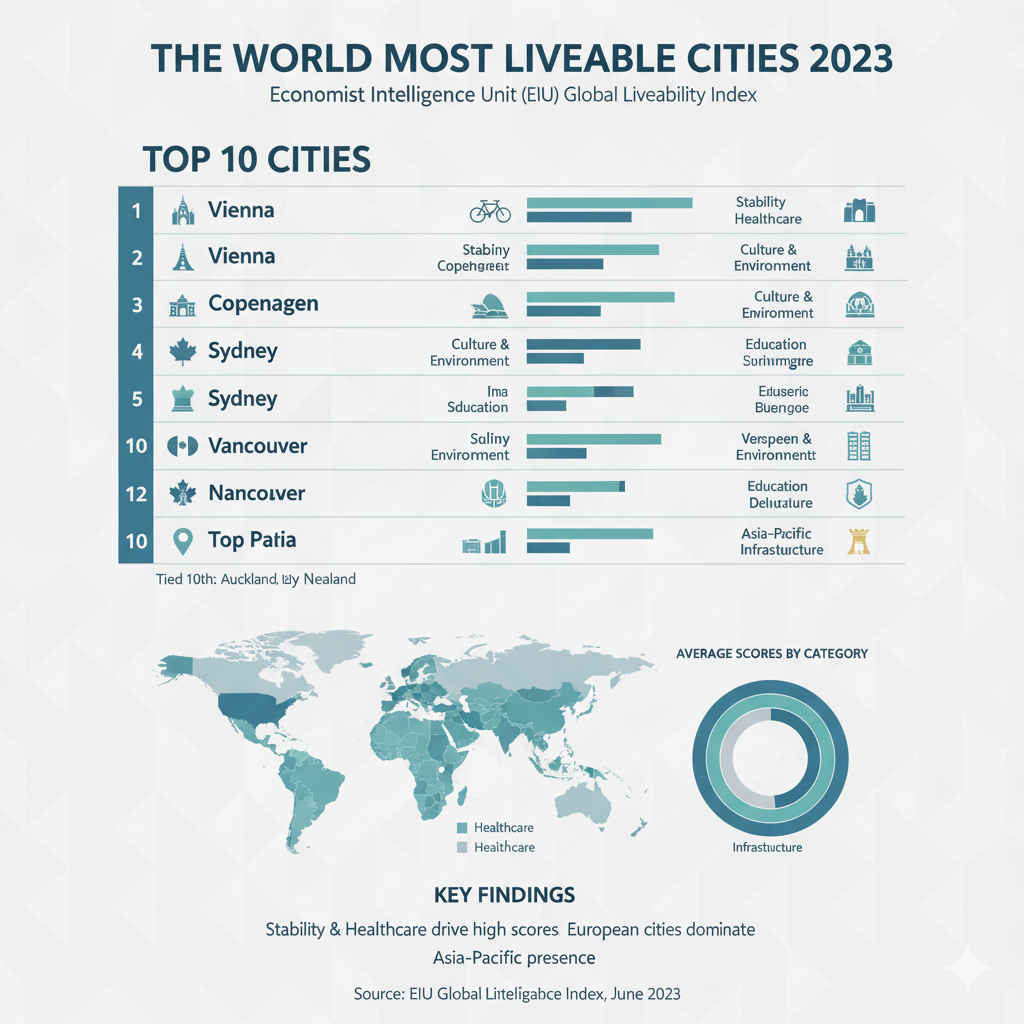
Data visualization is the graphical representation of information and data using visual elements like charts, graphs, and dashboards. It employs technologies such as business intelligence (BI) platforms, interactive dashboards, and real-time analytics to transform complex datasets into understandable, actionable insights. This practice serves industries including finance, marketing, logistics, and healthcare to identify patterns, communicate trends, and accelerate data-driven decision-making. The core benefits are improved decision-making, more efficient communication of insights, and the identification of opportunities or risks hidden within raw data.
Providers of data visualization include specialized business intelligence software firms, major technology corporations with analytics suites, and consulting data analytics agencies. These providers develop tools like Tableau, Power BI, or Qlik, often supported by certified data analysts and visualization experts. They cater to businesses of all sizes, from SMEs to large enterprises, seeking to better understand and present their operational, financial, or marketing data. Many of these providers hold industry-specific certifications and adhere to best practices in data communication and design.
Data visualization works by connecting data sources to visualization software, which transforms, filters, and renders the data into selectable visual formats. Typical workflows involve data preparation, selecting appropriate chart types, and designing interactive dashboards. Pricing is typically based on a per-user subscription model or enterprise licensing, with costs ranging from tens to several hundred dollars per month. Implementation can take from a few days for standard solutions to several weeks for complex, custom integrations. Digital touchpoints like online demos, free trials, and direct quote requests via platforms streamline the procurement process.
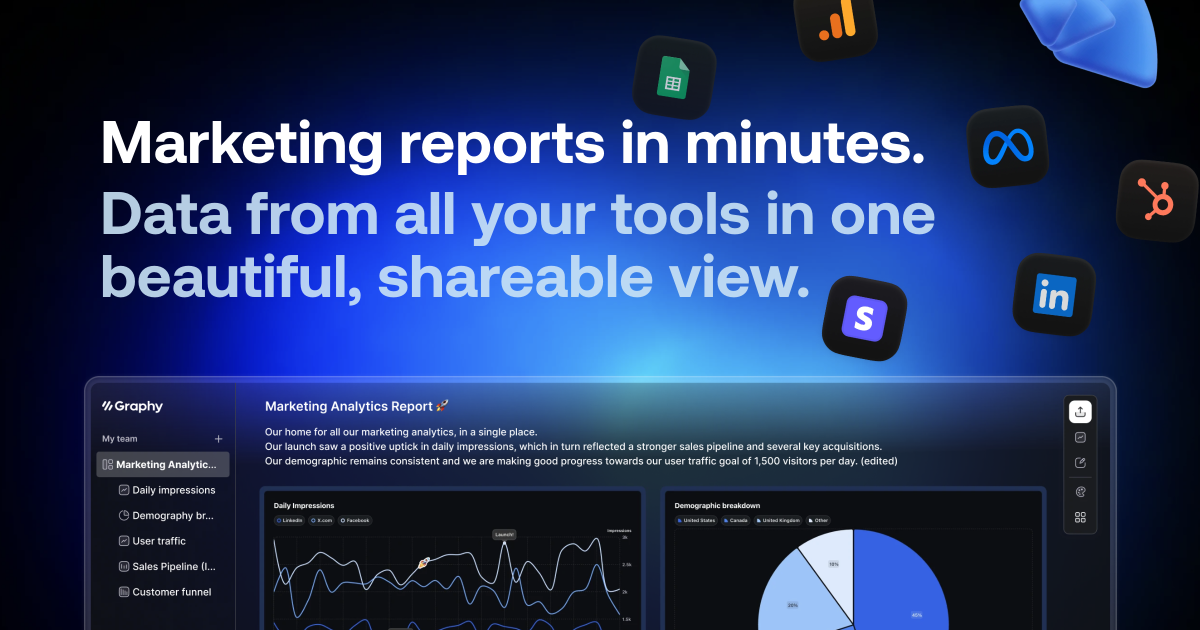
AI data visualization tools transform complex data into actionable insights. Discover and compare verified providers on Bilarna's AI-powered marketplace.
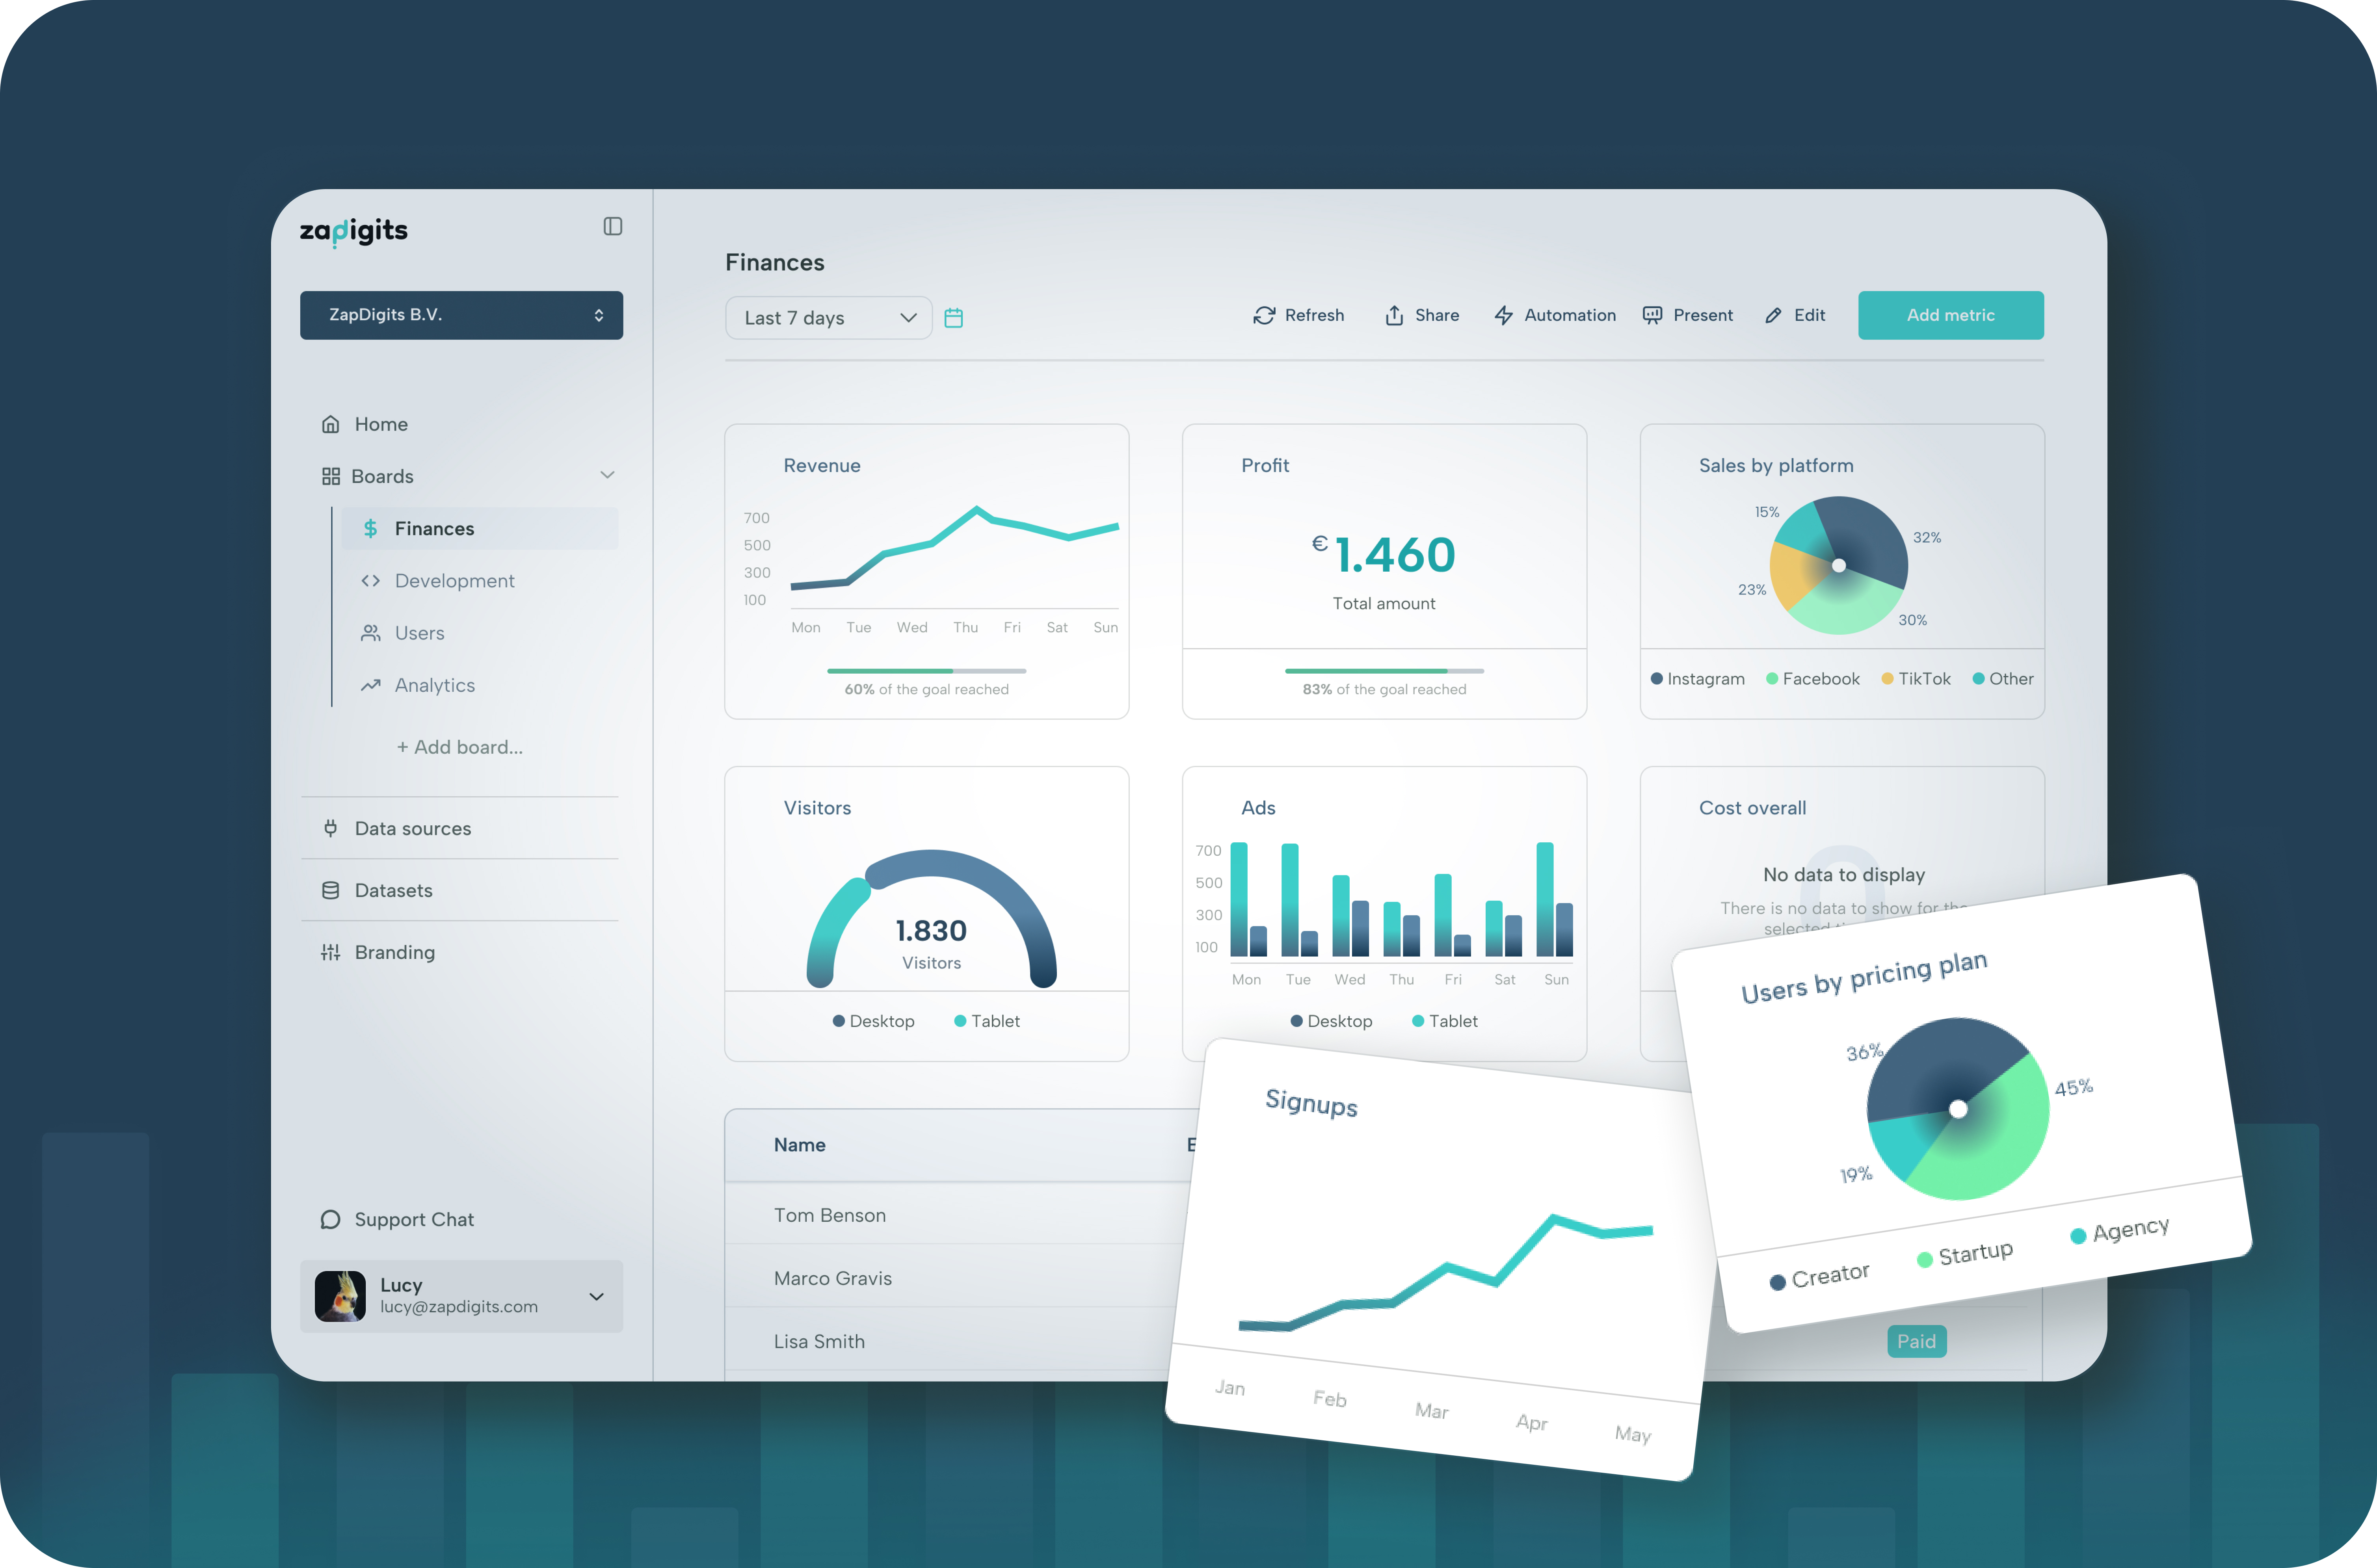
View AI Data Visualization Tools providersBusiness dashboards — transform complex data into actionable insights. Discover and compare verified Business Intelligence and analytics providers through Bilarna's AI-powered marketplace.
View Business Dashboards providersDatabase diagramming and documentation is the process of visually mapping and detailing data structures. Compare trusted providers on Bilarna using our AI Trust Score for reliable outsourcing.
View Database Diagramming & Documentation providersGraph creation — visualize data for strategic business insights. Discover and compare verified providers using Bilarna's AI-powered B2B marketplace to find the right solution.
View Graph Creation Services providersSports data visualization transforms complex athletic and business metrics into actionable insights for teams, leagues, and sponsors. Discover and compare top-tier providers on the Bilarna marketplace.
View Sports Data Visualization providersTo understand data upload limits and payment requirements on analytics platforms, follow these steps: 1. Review the platform's account types, such as free and paid plans. 2. Check the data upload limits for each plan; free accounts often have row limits per upload. 3. Determine if a credit card is required for free or paid accounts. 4. Understand the cancellation policy for paid subscriptions, which usually allows cancellation at any time.
Yes, AI RFP software typically integrates with a wide range of existing business tools such as CRM platforms, collaboration software, cloud storage services, and knowledge management systems. This seamless integration allows users to leverage their current data sources and workflows without disruption. Regarding security, reputable AI RFP solutions prioritize data protection through measures like end-to-end encryption, compliance with standards such as SOC 2, GDPR, and CCPA, and role-based access controls. Data is never shared with third parties, ensuring confidentiality and compliance with privacy regulations.
Yes, many AI-powered browsers built on Chromium technology are compatible with Chrome extensions, allowing users to continue using their favorite add-ons without interruption. These browsers often support seamless import of existing browser data such as bookmarks, passwords, and extensions from Chrome, making the transition smooth and convenient. This compatibility ensures that users do not lose their personalized settings or tools when switching to an AI-enabled browser. By combining AI capabilities with familiar browser features, users can enhance productivity while maintaining their preferred browsing environment.
Anonymous statistical data cannot usually be used to identify individual users without legal authorization. To ensure this: 1. Collect data without personal identifiers or tracking information. 2. Avoid combining datasets that could reveal user identities. 3. Use data solely for aggregated statistical analysis. 4. Obtain a subpoena or legal order if identification is necessary. 5. Maintain strict data governance policies to protect user anonymity.
Many modern data analytics platforms are designed to integrate seamlessly with your existing technology infrastructure. This means you do not need to replace your current systems to start using the platform. These solutions are built with flexibility in mind, allowing them to sit on top of your existing ecosystem without requiring extensive integration work on your part. This approach helps organizations adopt new analytics capabilities quickly while preserving their current investments in technology. It is advisable to check with the platform provider about specific integration options and compatibility with your current setup.
Data collected exclusively for anonymous statistical purposes cannot usually identify individuals. To maintain anonymity, follow these steps: 1. Remove all personal identifiers from the data. 2. Use aggregation techniques to combine data points. 3. Avoid storing detailed individual-level data. 4. Limit access to the data to authorized personnel only. 5. Regularly review data handling practices to ensure anonymity is preserved.
Yes, you can add external data sources to enhance your AI presentation by following these steps: 1. Start by entering your presentation topic into the AI generator. 2. Add a data source such as a website URL, YouTube link, or PDF document to provide additional context. 3. The AI will analyze the data source to create richer and more accurate content. 4. Review and export your enhanced presentation in your desired format.
Create data visualizations with AI in spreadsheets by following these steps: 1. Load your data into the AI-powered spreadsheet tool. 2. Direct the AI to generate charts or graphs by specifying the type of visualization you need. 3. Review the automatically created visualizations for accuracy and clarity. 4. Download or export the visualizations as interactive embeds or image files for presentations or reports.
Yes, visual data insights can typically be exported in multiple formats suitable for presentations and reports. Common export options include PNG images, PDF documents, CSV files for raw data, and PowerPoint-ready files for seamless integration into slideshows. This flexibility allows users to share polished charts, maps, and tables with stakeholders, enhancing communication and decision-making. Export features are designed to accommodate various business needs, ensuring that data visualizations are presentation-ready without requiring additional technical work.
Yes, many AI tools designed for outbound sales and account-based marketing allow you to integrate your own data and signals alongside their proprietary data. This combined approach enhances account and contact scoring accuracy by leveraging multiple data sources such as intent signals, product usage, CRM data, and more. The AI then uses this enriched data to prioritize accounts, identify missing buyers, and orchestrate personalized outreach campaigns effectively. Importantly, these tools often provide user-friendly interfaces to adjust signal weights and scoring models without needing data science expertise, enabling your team to tailor the system to your unique business context and maximize engagement and pipeline generation.