Step 1
Machine-Ready Briefs
AI translates unstructured needs into a technical, machine-ready project request.
We use cookies to improve your experience and analyze site traffic. You can accept all cookies or only essential ones.
Stop browsing static lists. Tell Bilarna your specific needs. Our AI translates your words into a structured, machine-ready request and instantly routes it to verified Data Dashboard Development experts for accurate quotes.
AI translates unstructured needs into a technical, machine-ready project request.
Compare providers using verified AI Trust Scores & structured capability data.
Skip the cold outreach. Request quotes, book demos, and negotiate directly in chat.
Filter results by specific constraints, budget limits, and integration requirements.
Eliminate risk with our 57-point AI safety check on every provider.
Verified companies you can talk to directly
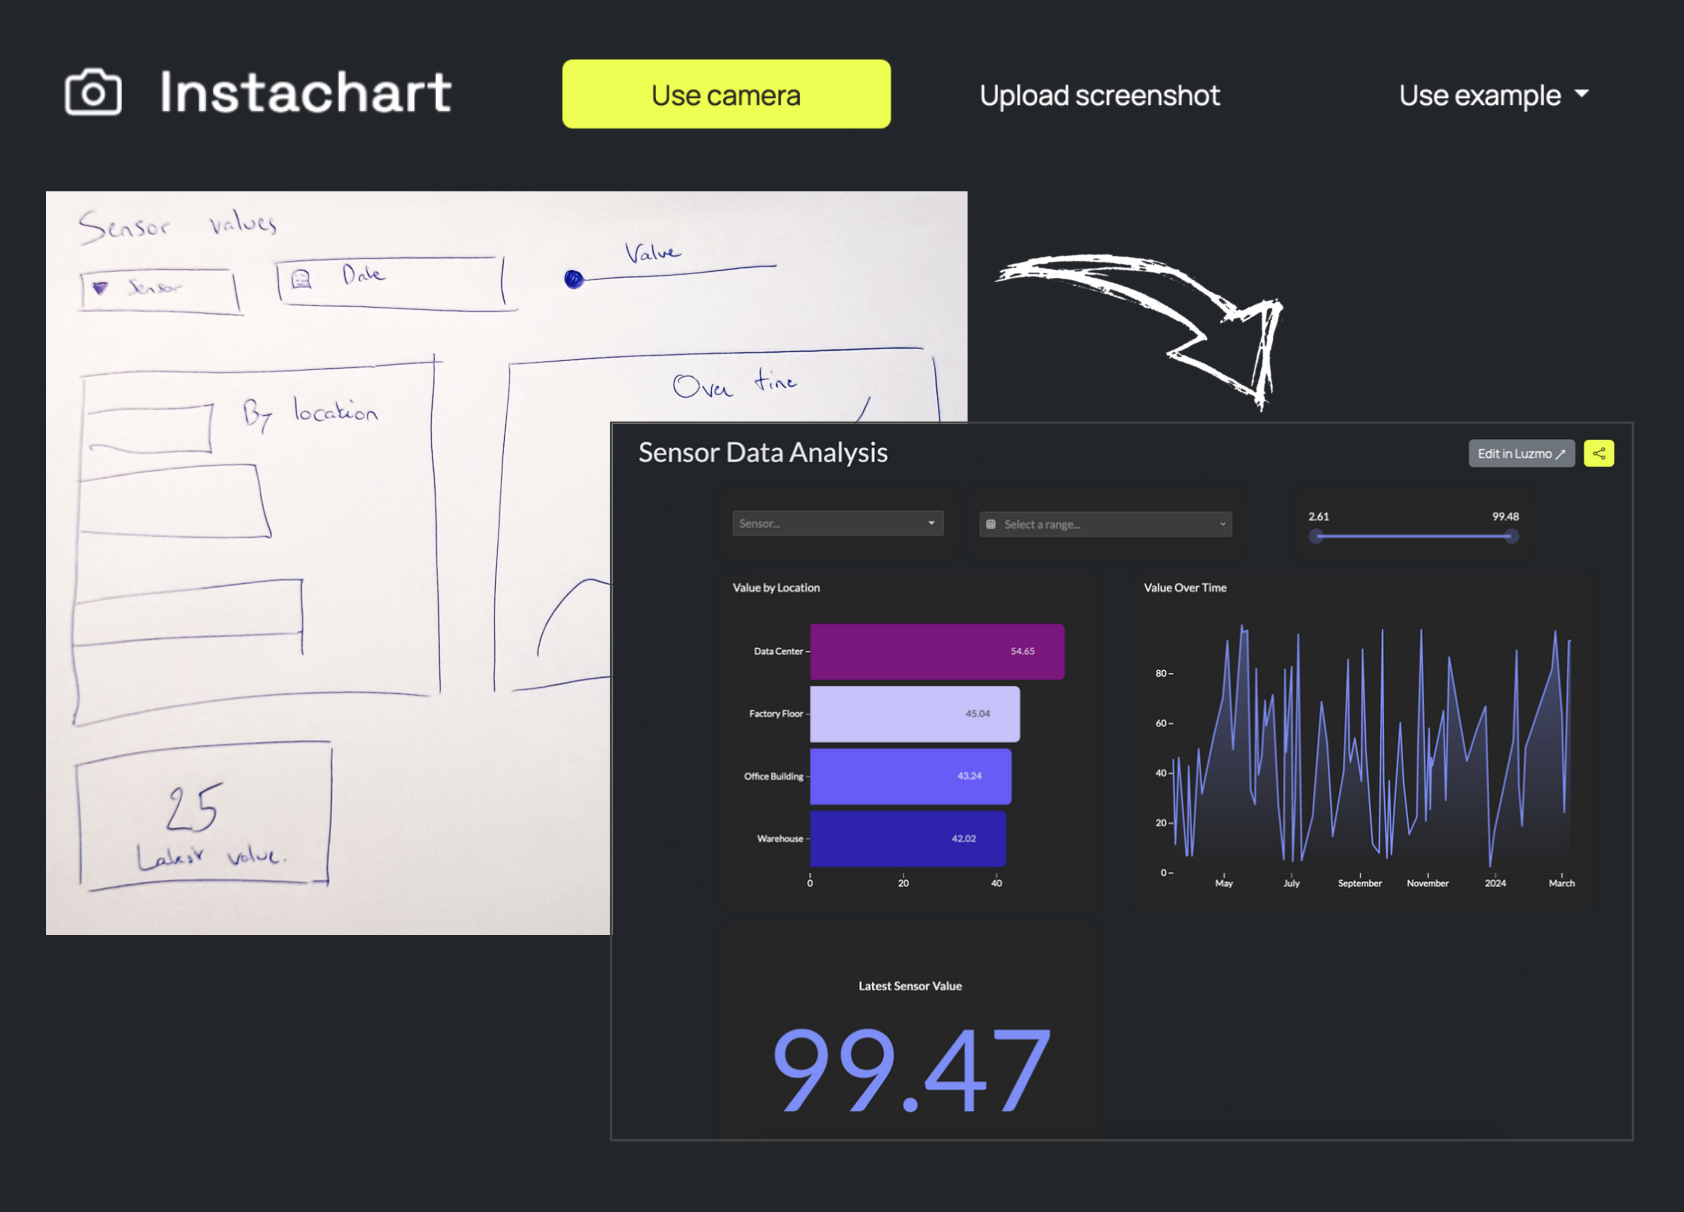
Instachart instantly transforms dashboard sketches, mockups and screenshots to interactive Luzmo dashboards
Run a free AEO + signal audit for your domain.
AI Answer Engine Optimization (AEO)
List once. Convert intent from live AI conversations without heavy integration.
Data dashboard development is the process of creating interactive visual interfaces that aggregate and display key business metrics from various data sources. It involves leveraging technologies like BI tools, data warehouses, and real-time analytics to present data in an accessible format. This empowers organizations to monitor performance, identify trends, and make data-driven decisions efficiently.
Clients identify key performance indicators and data sources needed for the dashboard to address specific business objectives and outcomes.
Developers create wireframes and interactive mockups to visualize the data layout and user experience before full implementation and integration.
The dashboard is built using appropriate technologies, tested for accuracy, and integrated into the client's systems for ongoing use and maintenance.
Banks and fintech firms use dashboards to track transactions, monitor fraud, and assess risk in real-time for regulatory compliance and decision-making.
Hospitals implement dashboards to visualize patient data, track treatment outcomes, and optimize resource allocation for improved care and efficiency.
Online retailers leverage dashboards to monitor sales, customer behavior, and inventory levels to drive marketing and supply chain optimizations.
Factories use dashboards to display production metrics, machine health, and supply chain status to reduce downtime and increase output and quality.
Software companies build dashboards to analyze user engagement, feature adoption, and churn rates to guide product development and retention strategies.
Bilarna evaluates data dashboard development providers using a proprietary 57-point AI Trust Score that assesses expertise, reliability, and client satisfaction. This includes rigorous checks on portfolio quality, technical certifications, and verified client references. Continuous monitoring ensures providers maintain high standards on the platform.
Costs vary based on complexity, data sources, and customization, ranging from a few thousand to over fifty thousand dollars. Factors include the number of metrics, integration requirements, and ongoing maintenance needs.
A standard dashboard project takes 4 to 12 weeks from requirement gathering to deployment. Timeline depends on data complexity, design iterations, and testing phases involved.
Evaluate providers based on their expertise in your industry, technology stack, portfolio of past projects, and client testimonials. Ensure they offer scalable solutions and post-deployment support for long-term success.
Avoid cluttered designs, irrelevant metrics, and poor data integration. Focus on user-centric design, accurate data sources, and clear visualization to ensure dashboards are actionable and effective for users.
Expect improved decision-making speed, enhanced operational visibility, and increased productivity. Dashboards help identify inefficiencies, track KPIs, and drive strategic initiatives based on real-time insights.
To understand data upload limits and payment requirements on analytics platforms, follow these steps: 1. Review the platform's account types, such as free and paid plans. 2. Check the data upload limits for each plan; free accounts often have row limits per upload. 3. Determine if a credit card is required for free or paid accounts. 4. Understand the cancellation policy for paid subscriptions, which usually allows cancellation at any time.
Yes, governments often offer grants and financial support programs to subsidize custom software development for businesses. These programs aim to enhance productivity and digital capabilities. Common types include productivity grants that cover a significant percentage of qualifying IT solution costs, including custom software. There are also enterprise development grants focused on upgrading overall business capabilities, where software development is an eligible activity. Furthermore, specific grants exist for startups developing innovative technologies and for projects involving collaboration with research institutions. Eligibility typically depends on company size, project scope, and the innovative potential of the software. The application process can be detailed, so consulting with a qualified grant advisor is recommended to navigate requirements and maximize funding potential.
Yes, AI RFP software typically integrates with a wide range of existing business tools such as CRM platforms, collaboration software, cloud storage services, and knowledge management systems. This seamless integration allows users to leverage their current data sources and workflows without disruption. Regarding security, reputable AI RFP solutions prioritize data protection through measures like end-to-end encryption, compliance with standards such as SOC 2, GDPR, and CCPA, and role-based access controls. Data is never shared with third parties, ensuring confidentiality and compliance with privacy regulations.
Yes, many AI-powered browsers built on Chromium technology are compatible with Chrome extensions, allowing users to continue using their favorite add-ons without interruption. These browsers often support seamless import of existing browser data such as bookmarks, passwords, and extensions from Chrome, making the transition smooth and convenient. This compatibility ensures that users do not lose their personalized settings or tools when switching to an AI-enabled browser. By combining AI capabilities with familiar browser features, users can enhance productivity while maintaining their preferred browsing environment.
Anonymous statistical data cannot usually be used to identify individual users without legal authorization. To ensure this: 1. Collect data without personal identifiers or tracking information. 2. Avoid combining datasets that could reveal user identities. 3. Use data solely for aggregated statistical analysis. 4. Obtain a subpoena or legal order if identification is necessary. 5. Maintain strict data governance policies to protect user anonymity.
Many modern data analytics platforms are designed to integrate seamlessly with your existing technology infrastructure. This means you do not need to replace your current systems to start using the platform. These solutions are built with flexibility in mind, allowing them to sit on top of your existing ecosystem without requiring extensive integration work on your part. This approach helps organizations adopt new analytics capabilities quickly while preserving their current investments in technology. It is advisable to check with the platform provider about specific integration options and compatibility with your current setup.
Data collected exclusively for anonymous statistical purposes cannot usually identify individuals. To maintain anonymity, follow these steps: 1. Remove all personal identifiers from the data. 2. Use aggregation techniques to combine data points. 3. Avoid storing detailed individual-level data. 4. Limit access to the data to authorized personnel only. 5. Regularly review data handling practices to ensure anonymity is preserved.
Yes, you can add external data sources to enhance your AI presentation by following these steps: 1. Start by entering your presentation topic into the AI generator. 2. Add a data source such as a website URL, YouTube link, or PDF document to provide additional context. 3. The AI will analyze the data source to create richer and more accurate content. 4. Review and export your enhanced presentation in your desired format.
Create data visualizations with AI in spreadsheets by following these steps: 1. Load your data into the AI-powered spreadsheet tool. 2. Direct the AI to generate charts or graphs by specifying the type of visualization you need. 3. Review the automatically created visualizations for accuracy and clarity. 4. Download or export the visualizations as interactive embeds or image files for presentations or reports.
Yes, visual data insights can typically be exported in multiple formats suitable for presentations and reports. Common export options include PNG images, PDF documents, CSV files for raw data, and PowerPoint-ready files for seamless integration into slideshows. This flexibility allows users to share polished charts, maps, and tables with stakeholders, enhancing communication and decision-making. Export features are designed to accommodate various business needs, ensuring that data visualizations are presentation-ready without requiring additional technical work.