Step 1
Comparison Shortlist
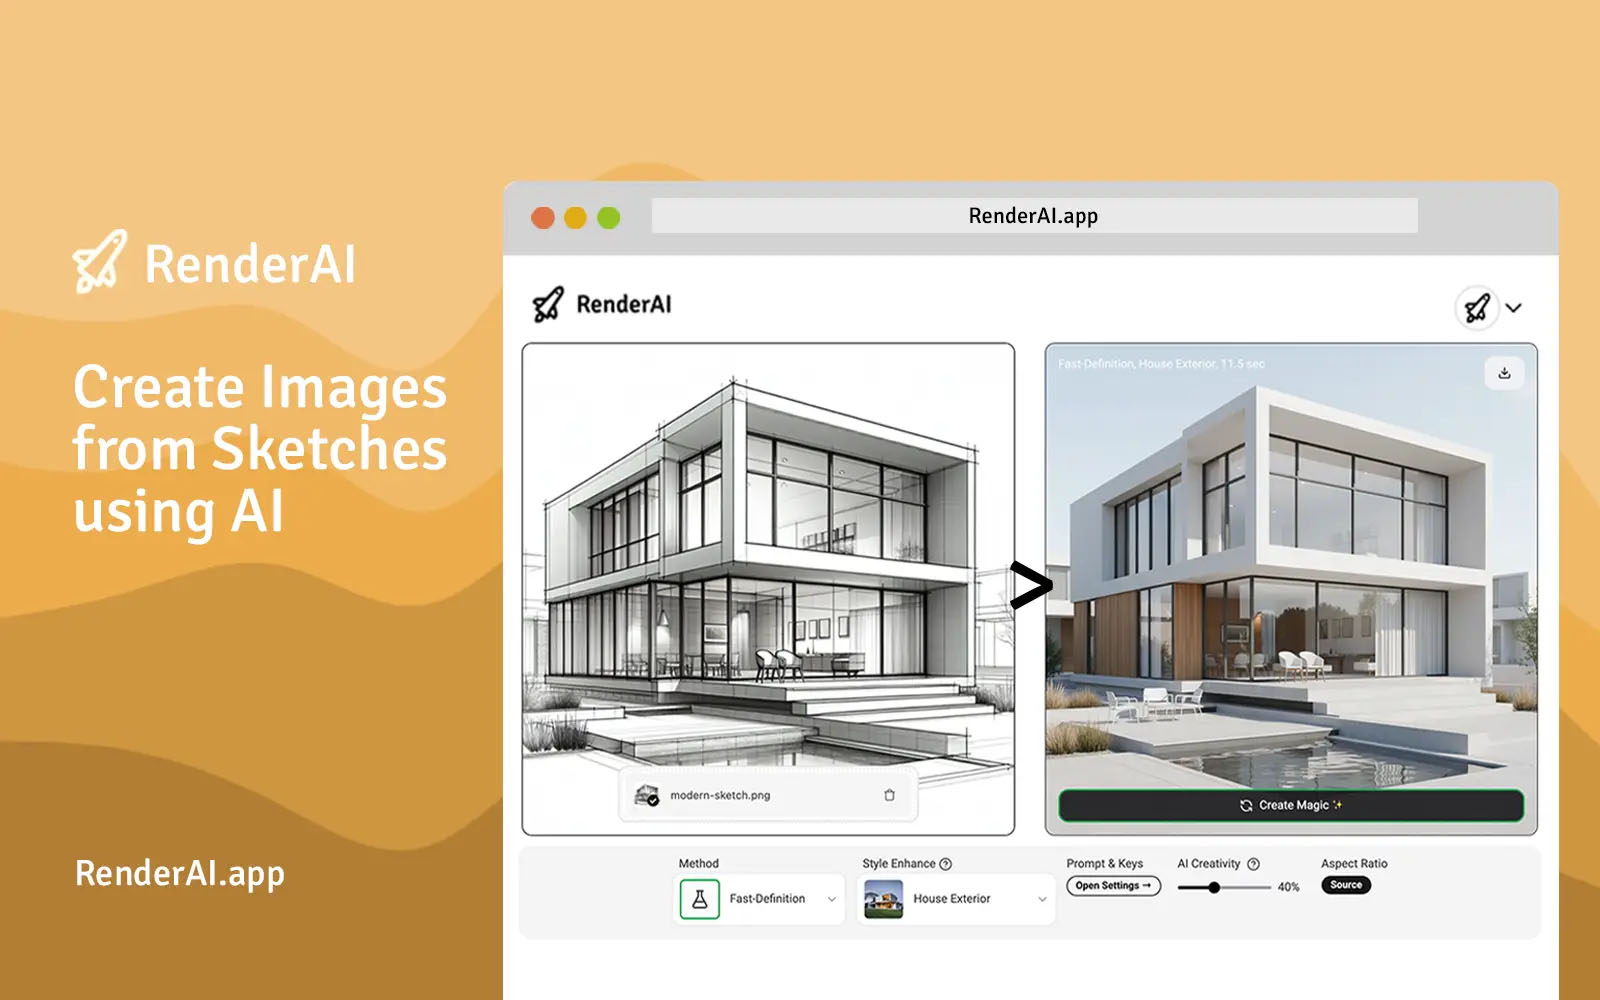
Machine-Ready Briefs: AI turns undefined needs into a technical project request.
We use cookies to improve your experience and analyze site traffic. You can accept all cookies or only essential ones.
Stop browsing static lists. Tell Bilarna your specific needs. Our AI translates your words into a structured, machine-ready request and instantly routes it to verified 3D Rendering & Visualization experts for accurate quotes.
Machine-Ready Briefs: AI turns undefined needs into a technical project request.
Verified Trust Scores: Compare providers using our 57-point AI safety check.
Direct Access: Skip cold outreach. Request quotes and book demos directly in chat.
Precision Matching: Filter matches by specific constraints, budget, and integrations.
Risk Elimination: Validated capacity signals reduce evaluation drag & risk.
Ranked by AI Trust Score & Capability


Run a free AEO + AI signal audit for your business domain.
AI Answer Engine Optimization — your business cited in ChatGPT, Gemini, and Perplexity results
List once. Convert intent from live AI conversations without heavy integration.
3D rendering and visualization is the digital process of generating photorealistic or stylized images, animations, or interactive experiences from 3D models. This technology utilizes advanced rendering engines like V-Ray, Arnold, or Unreal Engine to simulate materials, lighting, and physics, creating outputs used for design validation, marketing, and sales. It serves critical industries including architecture, product design, real estate, and manufacturing by replacing costly physical prototypes with accurate digital twins. The core benefits are significant cost reduction, accelerated time-to-market, improved design decision-making, and the ability to showcase products or spaces before they physically exist.
Providers of 3D rendering and visualization services are specialized 3D artists, visualization studios, architectural illustrators, and CGI agencies. These professionals typically hold expertise in software such as 3ds Max, Blender, or Cinema 4D and may have backgrounds in architecture, industrial design, or computer graphics. They cater to clients like advertising agencies, manufacturing firms, property developers, and e-commerce brands. Services range from basic product visualization for online catalogs to complex architectural fly-through animations for urban planning. Selecting a provider with relevant industry experience and a strong technical portfolio is essential for project success.
The service workflow typically starts with the client providing source files like CAD models, sketches, or mood boards. The provider then models, textures, lights, and renders the scene, often using GPU or cloud rendering farms for speed. Pricing is project-dependent: a single product render may cost $250-$800, while a full architectural animation can range from $5,000 to $20,000+. Common models include per-image pricing, hourly rates, or project-based retainers. Delivery is digital via secure portals, with standard turnaround times of 5-15 business days. Most providers include 1-3 revision rounds and communicate through project management platforms or direct review tools.
Reputable AI girlfriend apps prioritize user safety and privacy through encryption, data anonymization, and strict no-tracking policies. Conversations are typically end-to-end encrypted, meaning neither the company nor third parties can read them. Many platforms do not store personal information or share data with advertisers. They allow users to interact anonymously without linking to real-world identities. Additionally, these apps often include features like auto-deletion of chat logs, biometric authentication, and the option to use pseudonyms. However, safety also depends on the user's own practices, such as avoiding sharing sensitive personal information. It is important to choose apps that have transparent privacy policies, undergo independent security audits, and are developed by teams with expertise in ethical AI. Overall, when used responsibly and on trusted platforms, AI girlfriend apps can provide a secure environment for emotional exploration and companionship.
Yes, AI masks are legally safe and users retain ownership by following these steps: 1. Verify your real identity as required by the platform to comply with legal regulations. 2. Use AI masks ethically and avoid violating terms of service. 3. Understand that AI masks are generated and do not steal anyone's identity. 4. Create and publish content with AI masks knowing you have full commercial license and ownership over your masked videos and photos. 5. Avoid using AI masks for unethical purposes to maintain compliance and safety.
AI photo filters require credits to use. New users receive 10 free credits upon registration to try the filters. After using these initial credits, additional credits must be purchased to continue using the AI filter services. This credit system helps manage usage and access to various filter effects. Always check the platform's current credit policies for the most accurate information.
Yes, AI voice and SMS agents designed for healthcare are built with security and compliance in mind. They adhere to industry standards and regulations such as HIPAA (Health Insurance Portability and Accountability Act) to protect patient data privacy and security. Business Associate Agreements (BAAs) are available to formalize compliance commitments. Additionally, these agents comply with regulations like TCPA (Telephone Consumer Protection Act) and PCI (Payment Card Industry) standards where applicable. Ensuring security and regulatory compliance is critical to maintaining trust and safeguarding sensitive healthcare information while leveraging AI technologies.
Confirm that AI-generated poems are free from copyright and plagiarism by following these steps: 1. Understand that poems are created by an AI language model trained on a custom dataset. 2. Recognize that each poem is unique and not copied from existing works. 3. Use the poems freely for commercial or noncommercial purposes without needing permission or attribution. 4. Trust that the AI ensures originality and copyright-free content.
Yes, ongoing changes and updates to a website are typically included in a standard monthly subscription fee. This service model ensures your site remains functional, modern, and up-to-date without incurring additional one-off costs for modifications. The included updates cover content changes, minor design tweaks, and general maintenance to keep the site running smoothly. This approach provides predictable budgeting and continuous support, allowing you to adapt your site as your business evolves. It is distinct from one-time development projects and focuses on long-term site management.
Yes, cheap Windows product keys from reputable online retailers can be legitimate and safe, provided they are sourced from verified channels. These sellers typically obtain surplus or volume license keys from legitimate distributors, making them genuine Microsoft licenses at a lower cost. The key safety indicators include the seller providing a money-back guarantee, offering instant email delivery of the key, and having clear customer support for activation issues. It is crucial to avoid keys sold at prices that seem too good to be true, as these may be unauthorized or volume license violations. A legitimate key will activate your Windows or Office software permanently and grant access to all official updates and features from Microsoft without legal risk.
Yes, when properly manufactured and maintained, copper water bottles and cookware are considered safe and healthy. Copper is a natural mineral that the human body requires in trace amounts. Water stored in a copper bottle for several hours undergoes a natural purification process through the release of copper ions, which is traditionally believed to support digestion and immunity. For cookware, a key safety feature is the interior tinning, which creates a protective barrier that prevents food from directly contacting the copper, ensuring safe cooking and preserving flavor. It is important to avoid storing highly acidic foods in copper for prolonged periods and to maintain the tin lining when it wears down from regular use. These traditional practices ensure the health benefits and safety of using quality copper products.
Yes, many products on this page are offered with significant discounts and promotions. For example, the Anycubic Kobra X 3D printer is marked with a 25% discount, reducing its price from 25,999.20 TL to 19,499.04 TL. The Creality Falcon2 Pro 40W laser engraver shows a 10% discount, and the Bambu Lab H2D Pro Ams Combo has a 12% discount. Some items are labeled as new products, and a few are shown as sold out. The page displays both the original and discounted prices for comparison, helping buyers identify deals. Discounts range from 10% to 25%, with the highest savings on select models.
Extended warranties on appliances and electronics are often not worth the cost for most consumers due to their low statistical likelihood of paying out relative to their price. Retailers aggressively sell these warranties because they are highly profitable, with a significant portion of the fee being pure margin. The manufacturer's original warranty already covers the initial period when defects are most likely to appear. For products with a high reliability rate, you are essentially betting against the odds, and the cost of the warranty may approach or even exceed the probable repair cost. A more financially prudent approach is to self-insure by setting aside the money you would have spent on warranties into a savings fund dedicated for potential repairs or future replacement, which gives you flexibility and control over the funds.